
Calculate Waste Hauling Frequency for Plants
Table of Contents
- Why Waste Hauling Frequency Matters for Manufacturing Plants
- Step 1: Determine Your Manufacturing Waste Generation Rate
- Step 2: Perform a Dumpster Fill Rate Calculation
- Step 3: Build a Waste Hauling Schedule That Matches Production
- Step 4: Waste Container Capacity Planning and Safety Thresholds
- Worked Example: Calculating Hauling Frequency for a Pittsburgh-Area Plant
- How to Reduce Hauling Frequency Without Overflowing Containers
- Frequently Asked Questions
Last Updated: October 12, 2026
Why Waste Hauling Frequency Matters for Manufacturing Plants
Getting waste hauling frequency right is one of the fastest ways a plant can cut costs without touching production. Knowing how to calculate waste hauling frequency for manufacturing plants turns that guesswork into a number you can defend.
Waste hauling frequency is the scheduled number of times per week or month that a waste container is picked up and replaced. Set it too high, and you pay for trucks that haul mostly air.
That trade-off is the whole game. Below, we break the calculation into four steps, show a worked example, and cover how to stretch your schedule without overflowing a single bin.
Step 1: Determine Your Manufacturing Waste Generation Rate
Your manufacturing waste generation rate is the total volume of waste your plant produces per day, measured in cubic yards and split by waste stream. Everything downstream depends on this number, so get it right before you plan any pickups.
Collecting Waste Volume Data by Stream
Start by separating waste types. Cardboard, wood pallets, plastic film, metal scrap, and general trash all behave differently in a container. Track each one on its own line.
- Count how many containers each stream fills per shift
- Note the container size in cubic yards
- Log it daily for two full weeks to catch normal variation
A common mistake is measuring only total trash. Mixed streams hide the real driver behind your waste volume.
Calculating Daily and Weekly Generation Rates
Add each stream's daily volume, then multiply by operating days to get your weekly total. If your plant runs five days a week and produces about 4 cubic yards of cardboard a day, that stream alone generates roughly 20 cubic yards weekly. Do this for every stream, then sum them for your plant-wide rate.
Step 2: Perform a Dumpster Fill Rate Calculation
A dumpster fill rate calculation tells you how many production days it takes to fill one container. The core formula is:
Fill rate (days) = Usable container capacity (cubic yards) ÷ Adjusted daily waste volume (cubic yards per day)
But the usable capacity is not the nominal size on the container. It is the volume you can safely fill without exceeding the fill line, blocking the lid, or creating an overload. For most roll-off containers, plan on 80-85% of the rated capacity as your working volume. A 40-cubic-yard container, for example, has a practical working capacity of about 32-34 cubic yards.
Container Sizing and Safe Fill Thresholds
Different container sizes have different practical limits. Here is how the math works for the two sizes we supply:
- 20-yard dumpster: Rated at 20 cubic yards. Working capacity at an 85% fill ceiling is about 17 cubic yards. Suitable for heavier, denser waste or smaller production lines.
- 25-yard dumpster: Rated at 25 cubic yards. Working capacity at an 85% fill ceiling is about 21 cubic yards. A middle ground for plants with moderate volume and limited floor space.
Never plan to fill a container to 100%. Overfilled bins spill, block access, and create hazards. Most haulers reject overloaded containers or charge extra fees, and an overflowing bin can trigger safety violations.
Accounting for Compaction and Material Density
Density changes everything. Loose cardboard and plastic film fill a container fast because they trap air. Heavy scrap settles and packs tight. If you compact on site, the same waste takes up far less room, which stretches your fill rate.
Compaction ratios vary by material:
- Cardboard and paper: 3:1 to 6:1 with a vertical compactor
- Plastic film and wrap: 4:1 to 8:1
- Mixed general trash: 2:1 to 4:1
If you run a compactor, divide your daily waste volume by the compaction ratio before using the fill rate formula.
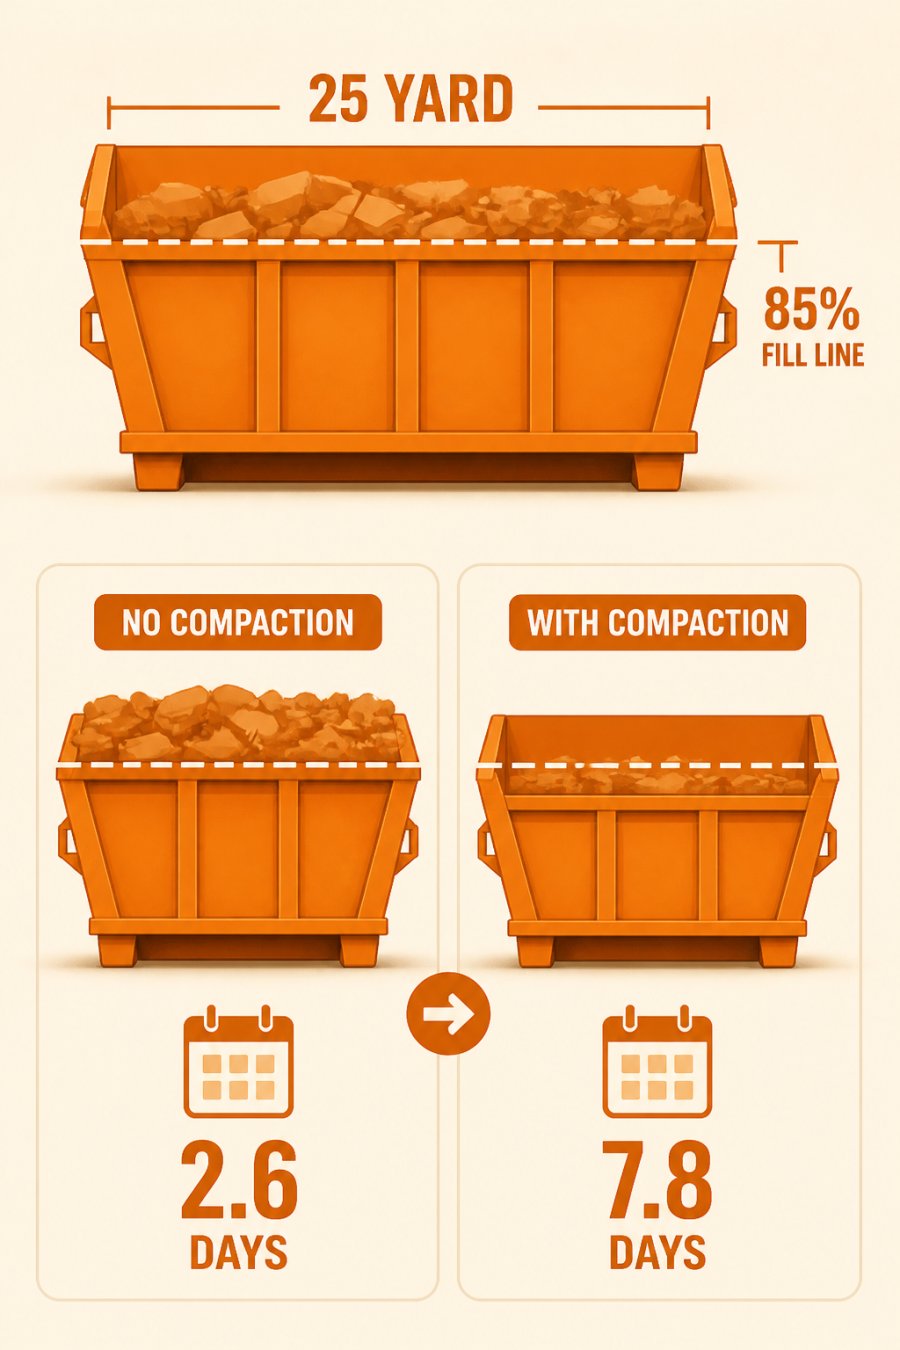
Worked Example: Fill Rate for a 25-Yard Container
Suppose a plant generates 8 cubic yards of mixed manufacturing waste per day. It uses a 25-yard dumpster with an 85% fill ceiling, giving a working capacity of about 21 cubic yards.
- Without compaction: 21 ÷ 8 = 2.6 days to fill
- With a 3:1 compactor on general trash: 8 ÷ 3 = 2.7 cubic yards per day; 21 ÷ 2.7 = 7.8 days to fill
That difference, 2.6 days versus 7.8 days, is the entire basis for scheduling pickups. If you set a weekly pickup without compaction, the container overflows before day 7.
Step 3: Build a Waste Hauling Schedule That Matches Production
A waste hauling schedule should mirror your production calendar, not a generic weekly rhythm. The goal is to empty each container before it reaches its safe fill line, while minimizing the number of truck trips. That means calculating a pickup interval for each waste stream separately, then consolidating pickups where possible.
Calculating Pickup Interval by Waste Stream
Use the fill rate from Step 2 to set a pickup interval for each stream:
Pickup interval (days) = Working capacity (cubic yards) ÷ Adjusted daily volume (cubic yards per day) − Safety buffer (days)
A common safety buffer is one production day. That gives you a margin for unexpected spikes, bulky items that do not settle, or a missed pickup.
Here is how that plays out for a plant running five days a week with a 25-yard container (21 cubic yards working capacity):
| Waste Stream | Daily Volume (cu yd) | Compaction Ratio | Adjusted Daily Volume | Fill Rate (days) | Pickup Interval (days) |
|---|---|---|---|---|---|
| Cardboard | 6 | 4:1 | 1.5 | 14.0 | 13 |
| Plastic film | 2 | 6:1 | 0.33 | 63.6 | 62 |
| General trash | 4 | 3:1 | 1.33 | 15.8 | 14 |
| Metal scrap | 3 | 1:1 | 3.0 | 7.0 | 6 |
In this example, metal scrap fills the container fastest and needs a pickup every 6 production days. Cardboard and general trash can go two weeks. Plastic film could go months, but storage space and odor control usually force a more frequent pickup.
Adjusting for Shifts, Seasonality, and Production Variability
Production demand moves. A plant running three shifts generates more waste than one running a single shift. Seasonal spikes, big orders, and changeovers all shift your daily demand.
- Multiple shifts: If you run two or three shifts, calculate daily volume across all shifts, not just the day shift. A plant that generates 4 cubic yards on day shift may generate 10 cubic yards across three shifts.
- Seasonal peaks: If your production jumps 30% during peak season, your waste volume likely jumps similarly. Build a peak-season schedule with shorter intervals and a slow-season schedule with longer intervals.
- Shutdowns: During planned shutdowns, waste generation may drop to near zero. Pause pickups or extend intervals to avoid paying for empty containers.
- Changeovers: A product changeover can generate a burst of scrap, packaging, and rejected material. Schedule a pickup immediately after major changeovers rather than waiting for the regular interval.
Waste-Stream-Specific Scheduling
Different waste streams have different storage and handling requirements, which affect how often they can be picked up:
- General solid waste: Can typically be stored for a week or more if containers are lidded and pest control is managed. Odor and pests are the limiting factors in warm months.
- Recyclables (cardboard, metal, plastic): Can be stored longer if baled or compacted. Loose cardboard takes up space and becomes a fire hazard if allowed to accumulate.
- Hazardous waste: Subject to storage time limits under federal and state regulations. Most facilities must ship hazardous waste within 90 days of accumulation. Check your generator status and accumulation start date.
- Food waste and organic material: Decomposes quickly and attracts pests. In most plants, this stream needs pickup at least weekly, and more often in summer.
Consolidating Pickups Without Overflowing
Once you have intervals for each stream, look for consolidation opportunities.
A simple scheduling rule: pick up the fastest-filling stream on its interval, and add other streams to that pickup if they are at or above 70% of their working capacity.
Step 4: Waste Container Capacity Planning and Safety Thresholds
Waste container capacity planning means sizing containers so waste never exceeds a safe fill level. Never plan to fill a container to 100%. Overfilled bins spill, block access, and create hazards.
- Target a fill ceiling well below the top of the container
- Keep lids closable so rain does not add weight
- Leave room for bulky items that do not settle
Worked Example: Calculating Hauling Frequency for a Pittsburgh-Area Plant
Say a local plant generates 30 cubic yards of waste per day across all streams. It uses a 40-cubic-yard roll-off container. Divide 40 by 30 and the container fills in about 1.33 days.
Subtract a one-day safety buffer, and you get a hauling frequency of about every day. That is a lot of truck trips and a lot of cost. Now add on-site compaction.
That single change is where the savings live.
| Scenario | Daily Volume | Container Size | Fill Rate | Hauling Frequency |
|---|---|---|---|---|
| No compaction | 30 cu yd | 40 cu yd | ~1.3 days | Daily |
| With compaction | ~9 cu yd | 40 cu yd | ~4.4 days | ~2x per week |
How to Reduce Hauling Frequency Without Overflowing Containers
Reducing hauling frequency comes down to cutting waste volume before it hits the container. Less volume per day means a slower fill rate and fewer trips.
- Compact on site to squeeze air out of bulky waste
- Improve waste prevention and material usage to cut scrap at the source
- Recycle high-volume streams like cardboard and metal separately
- Right-size containers to your real generation rate
Every truck trip you remove also trims fuel use and emissions, which supports your sustainability goals. To see how on-site compaction fits your operation, explore our dumpster service and how we schedule it around production.
Frequently Asked Questions
How do you calculate waste hauling frequency for a manufacturing plant?
Divide your container capacity by your daily waste generation rate to find the fill rate in days, then subtract a one-day safety buffer. For example, if a 40-cubic-yard dumpster receives 20 cubic yards of manufacturing waste per day, it fills in two days. Schedule hauling every day to prevent overflow. Adjust for shifts, seasonality, and compaction when your production volume changes.
What is a manufacturing waste generation rate and how do you measure it?
A manufacturing waste generation rate is the volume or weight of waste your plant produces per unit of time, usually expressed in cubic yards per day or tons per week. Measure it by tracking container fill levels daily for two to four weeks, or by weighing hauls. Record each waste stream separately because scrap metal, packaging, and general refuse have different densities and fill rates.
How often should a manufacturing plant schedule waste pickups?
Schedule pickups so containers never exceed 80% capacity before the truck arrives. If your dumpster fill rate calculation shows a container fills in three days, haul every two days. Plants running multiple shifts or seasonal production spikes may need daily service during peak periods and less frequent pickups during slow months. Review your waste hauling schedule quarterly.
How can a plant reduce waste hauling frequency without overflowing containers?
On-site compaction is the most direct method. Compacting waste inside the dumpster can reduce volume significantly, which means fewer truck trips for the same amount of material. You can also separate recyclable streams, bale cardboard, and run a lean manufacturing review to cut scrap at the source. Combined, these steps lower both hauling frequency and disposal costs.
Waste hauling frequency is not a set-and-forget number. It shifts with production, seasons, and process changes, and guessing at it costs real money every month. Junk Crusher helps Western Pennsylvania manufacturers stop paying to haul empty space with mobile on-site compaction that cuts roll-off volume by up to 70%, reduces required hauls, and lowers dumpster fees. Get started with Junk Crusher and book a crush to turn your waste schedule into a cost advantage.


