
3 Steps to Track Waste Management Performance Metrics
Last Updated: October 29, 2026
Quick Summary
To track waste management metrics, first run a one-week waste audit of each stream to set a baseline, then choose three to five KPIs such as waste generation rate, diversion rate, contamination rate, cost per ton, and haul frequency. Calculate diversion rate by dividing diverted weight by total waste weight and multiplying by 100, keep data boundaries consistent, and assign one owner per metric with a set review cadence.
- A waste audit weighs or estimates one full week of volume per stream and notes contamination per container.
- Pick three to five KPIs; more than that and nobody owns them.
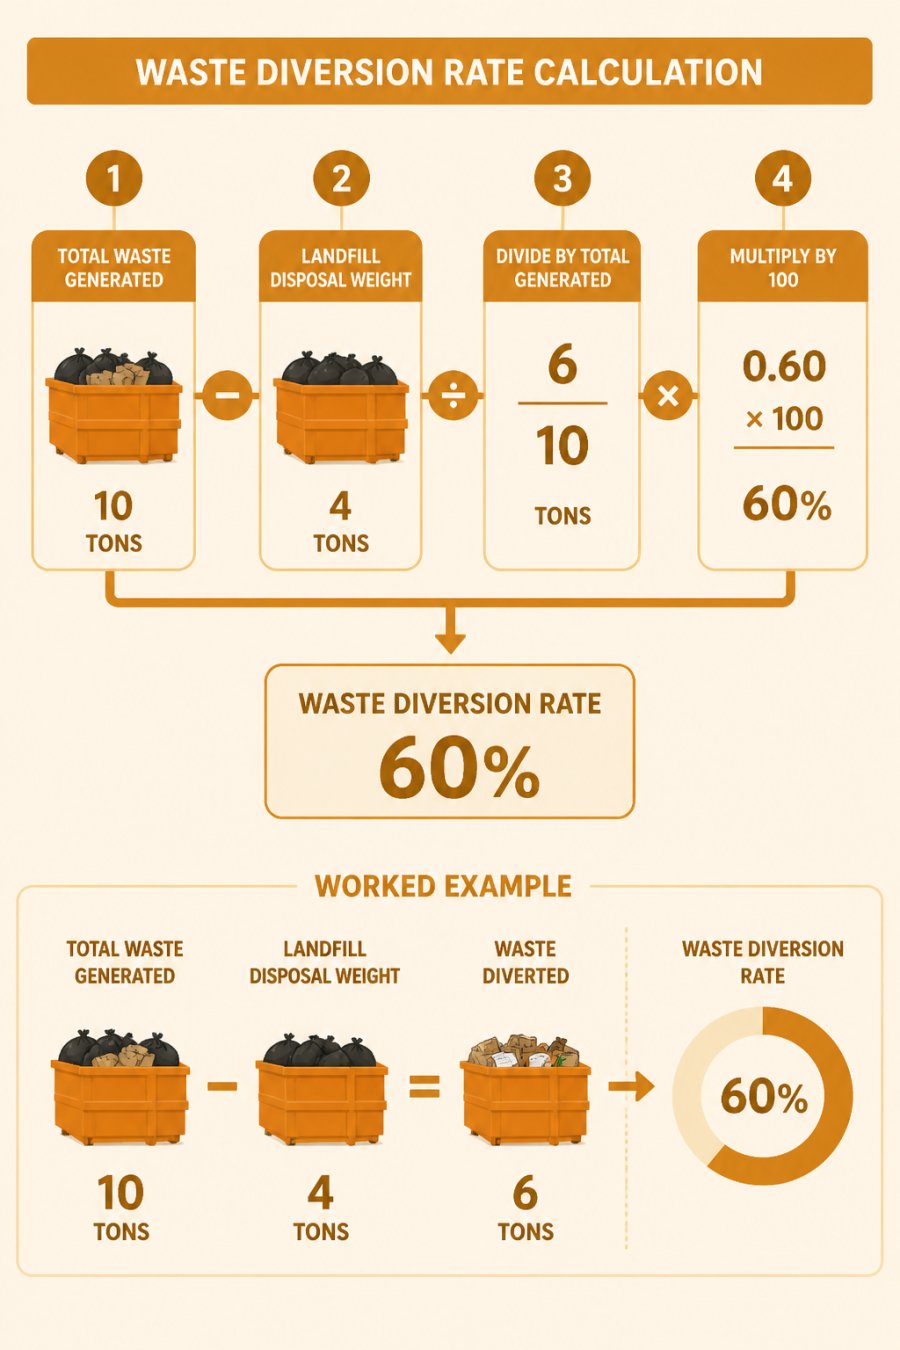
- Example: 10 tons generated with 6 tons diverted gives a 60% diversion rate.
- Keep the same data boundary every month or your trend analysis lies.
- Define your KPIs before buying waste tracking software, not after.
Table of Contents
- Step 1: Build Your Industrial Waste Management KPIs and Audit Checklist
- Step 2: Master Waste Diversion Rate Calculation and Data Boundaries
- Step 3: Choose Waste Tracking Software and Set Review Cadence
- Frequently Asked Questions
Step 1: Build Your Industrial Waste Management KPIs and Audit Checklist
Tracking waste management metrics starts with knowing what you generate. A waste audit turns guesswork into baseline measurement.
Walk each stream: landfill, recycling, cardboard, metal, organics. Weigh or estimate volume for one full week and note contamination per container.
Then set your industrial waste management KPIs:
- Waste generation rate by line or shift
- Diversion rate across all streams
- Contamination rate in recycling
- Cost per ton hauled
- Haul frequency per container
Pick three to five; more and nobody owns them. Warehouse waste management cost benchmarks can help you set realistic targets for each one.
Here are the core waste metrics the article recommends tracking.
| KPI | What it measures |
|---|---|
| Waste generation rate | Waste by line or shift |
| Diversion rate | Across all streams |
| Contamination rate | In recycling |
| Cost per ton | Cost hauled |
| Haul frequency | Per container |
Step 2: Master Waste Diversion Rate Calculation and Data Boundaries
The waste diversion rate calculation is simple: divide diverted weight by total waste weight, then multiply by 100.
Example: 10 tons generated, 6 tons diverted leaves a 60% diversion rate. Decide upfront whether you count construction debris, pallets, or scrap metal, and keep the same boundary every month or your trend analysis lies.
Boundaries also depend on hauling schedules.
Step 3: Choose Waste Tracking Software and Set Review Cadence
Waste tracking software turns scale tickets and hauler invoices into a reporting dashboard. Look for stream-level data entry, cost per ton reporting, and export for sustainability reporting.
A common mistake is buying software before defining metrics. Pick your KPIs first, then match the tool.
Set a review cadence:
Assign one owner per metric. When a number slips, that person runs the fix. Performance monitoring without accountability is just reporting. For guidance on turning tracking insights into savings, see waste hauling cost reduction for businesses.
Tracking waste management metrics only pays off when the numbers drive action. If your data shows containers hauling mostly empty space, that is wasted money on every trip. Junk Crusher's mobile on-site dumpster compaction crushes waste where it sits, reducing roll-off volume by up to 70% and cutting the number of hauls you pay for. That means fewer truck trips and a smaller carbon footprint. Get started with Junk Crusher and turn your waste data into real savings. Book a Crush.
Frequently Asked Questions
What are the most important waste management metrics to track first?
Start with four: waste generation rate (tons per month or per production unit), cost per ton, waste diversion rate, and contamination rate. These four cover volume, cost, environmental performance, and data quality. Add greenhouse gas emissions and hauling frequency once your baseline is stable. Tracking too many metrics at once spreads your data collection thin and makes trend analysis unreliable, so lock in these core numbers for at least one full quarter before expanding.
How do you calculate a waste diversion rate?
Divide the weight of diverted material (recycled, reused, or composted) by total waste generated, then multiply by 100. For example, if a plant generates 10 tons in a month and diverts 6 tons, the diversion rate is 60%. Use weight, not volume, and keep your measurement boundaries consistent, meaning the same buildings, shifts, and material streams each period. Inconsistent boundaries are the most common reason diversion rates look better or worse than they really are.
How can businesses reduce dumpster pickups and hauling volume?
The fastest lever is compacting waste on site before it leaves the property. Mobile dumpster compaction crushes debris inside your existing roll-off, so each haul carries more material and you schedule fewer trips. Junk Crusher's service reduces dumpster volume by up to 70% and is built for construction, demolition, manufacturing, and distribution sites. Fewer hauls can lower cost per ton and cut the truck emissions tied to your waste stream.


