
How to Improve Logistics Flow in Distribution Centers
Table of Contents
- Step 1: Run an End-to-End Logistics Flow Audit
- Step 2: Fix Warehouse Layout Optimization Before Adding Technology
- Step 3: Track Distribution Center Logistics KPIs That Drive Decisions
- Step 4: Choose a Warehouse Management System for Distribution Centers
- Step 5: Build a Cross-Docking Strategy for High-Velocity SKUs
- Step 6: Align Labor, Safety, and Yard Space with Your New Flow
- Common Mistakes That Stall Logistics Flow Improvements
- Conclusion: Measure, Adjust, Repeat
- Frequently Asked Questions
Last Updated: October 5, 2026
Step 1: Run an End-to-End Logistics Flow Audit
Improving logistics flow in distribution centers starts with a full audit, not a purchase order. At Junk Crusher, we see the same pattern at warehouses across Western Pennsylvania: managers buy software or add conveyors before they know where product actually slows down.
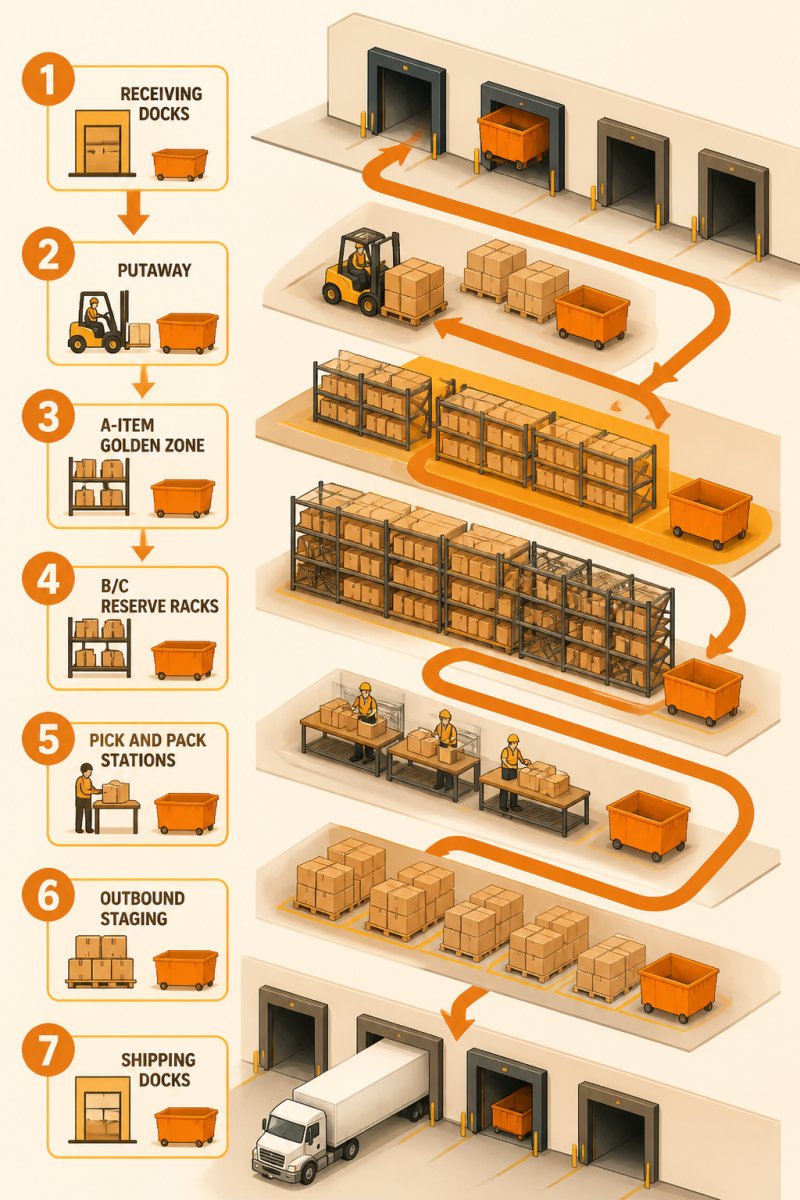
Logistics flow is the end-to-end movement of goods through a facility, from the moment a truck arrives at receiving until an outbound trailer leaves the dock. Every pause, double-handling step, and backtrack in that path costs time and money.
A common mistake is auditing only the pick line. The real delays often hide in receiving, putaway, or the yard.
Map Every Touchpoint from Receiving to Shipping
Walk the building and write down every place a product stops. Your map should cover:
- Trailer arrival and dock assignment
- Unloading and receiving check-in
- Putaway to storage location
- Replenishment to pick faces
- Picking, packing, and staging
- Loading and outbound dispatch
Most facilities find two or three steps nobody owns. That is where goods sit.
Time Each Stage to Find the Real Bottlenecks
A stopwatch beats a hunch. Time each stage across a full shift, then again during a demand peak.
Look for stages where wait time exceeds work time. A dock that unloads in 30 minutes but waits two hours for a putaway crew is your bottleneck, not your unload speed.
Step 2: Fix Warehouse Layout Optimization Before Adding Technology
Warehouse layout optimization is the fastest, cheapest way to improve logistics flow, and most facilities skip it. Software cannot fix a building where pickers walk past the same aisle six times a shift.
Start with traffic flow. Receiving, storage, and shipping should follow one direction with no crossing paths. When inbound and outbound traffic share a corridor, congestion builds at the worst possible moment.
Design Aisles and Pick Paths Around Travel Distance
Travel is the largest single time cost in most pick operations. A common pattern is that pickers spend more than half their shift walking. Three layout decisions drive that number:
- Aisle width. Wide aisles cost storage density; narrow aisles cut travel but reduce forklift clearance and two-way traffic. Match width to the equipment that actually runs the aisle, not to a generic standard.
- Pick path shape. A serpentine path through adjacent aisles beats a return path that sends pickers back to the main cross-aisle after every pick. If your pick module forces returns, you are paying for the same square footage twice.
- Cross-aisle placement. One well-placed cross-aisle shortens long runs; too many cross-aisles fragment storage and create collision points.
Slot Products by Velocity, Not by Category
Group products by how often they move, not by what they are. Fast movers belong in the golden zone: waist height, closest to packing and shipping.
A simple slotting rule:
- A items (fastest movers): nearest pick faces, ground to shoulder height
- B items: middle aisles
- C items (slow movers): upper racks and far corners
Reslot quarterly. Demand shifts, and old slotting plans quietly add walking time back into every order.
Separate Pedestrian and Vehicle Traffic
Flow improvements fail when a forklift and a picker meet in the same aisle at the same time. Practical separation options:
- Dedicated pedestrian walkways marked and enforced, not just painted
- One-way vehicle aisles in high-traffic zones
- Pick stations positioned so workers never step into a travel aisle to reach product
- Mirrors, gates, or sensors at blind corners where aisles intersect
Size Staging Areas to the Peak, Not the Average
Staging is where flow visibly breaks. Size outbound staging to your busiest hour of your busiest day, not to a typical Tuesday. If staged pallets spill into pick aisles, you have converted a shipping problem into a picking problem.
Step 3: Track Distribution Center Logistics KPIs That Drive Decisions
Distribution center logistics KPIs only matter if they change what you do next week. Track a small set, define each one the same way every time, and post the results where the team can see them.
| KPI | How to Calculate It | What It Tells You |
|---|---|---|
| Order cycle time | Order receipt time to ship time | Total flow speed |
| Dock-to-stock time | Trailer arrival to putaway complete | Receiving and putaway health |
| Pick rate per hour | Lines picked ÷ labor hours | Picking productivity |
| On-time delivery | On-time shipments ÷ total shipments | Delivery reliability |
| Inventory accuracy | Correct counts ÷ counts checked | Whether the system can be trusted |
How to Calculate Order Cycle Time and Dock-to-Stock Time
Order cycle time is the total elapsed time from when an order lands in your system to when it ships. If an order arrives at 8 a.m. and leaves at 2 p.m., cycle time is six hours.
Dock-to-stock time measures trailer arrival to putaway complete. This one exposes receiving bottlenecks that cycle time hides.
Track both daily. Averages hide problems, so watch your worst 10% of orders too.
Step 4: Choose a Warehouse Management System for Distribution Centers
A warehouse management system for distribution centers should follow your fixed process, not replace it. If your layout and slotting are wrong, a WMS will simply document the mess faster.
Before you shop, write down what you need:
- Real-time inventory visibility by location
- Directed putaway and picking
- Labor tracking against your KPIs
- Carrier and yard scheduling
- Reporting you will actually read
Then check integration. Your WMS has to talk to your ERP, your shipping system, and your carriers. A system that needs manual re-entry at any step adds work instead of removing it.
Roll it out one zone at a time. Full cutovers on a Monday morning rarely end well.
Step 5: Build a Cross-Docking Strategy for High-Velocity SKUs
A cross-docking strategy moves high-velocity SKUs straight from inbound to outbound trailers with little or no storage. For steady, predictable products, it removes putaway and picking from the flow entirely.
Cross-docking works best when:
- Demand for the SKU is steady and forecastable
- Inbound and outbound schedules line up
- Product is already labeled and ready to ship
It fails when receiving and shipping teams do not share a schedule. Start with one or two SKUs, prove the timing, then expand.
Step 6: Align Labor, Safety, and Yard Space with Your New Flow
Flow changes break old staffing patterns. If putaway is now the constraint, your receiving crew needs different shift coverage, not more pickers.
Rebalance Labor to the New Constraint
After a layout or process change, the bottleneck moves. A simple method:
- Identify the stage with the longest queue after the change.
- Count how many workers that stage needs to clear the queue within your target time.
- Shift headcount from stages that are now overstaffed.
- Re-check weekly for the first month, the constraint often moves again.
Cross-training matters here. If pickers can flex to putaway during a receiving surge, you smooth the flow without adding headcount.
Watch the Safety and Ergonomics Trade-Offs
Faster flow can quietly raise injury risk. Common trade-offs:
- Higher pick rates push workers toward unsafe lifting and reaching habits. Rate targets should never outrun safe technique.
- Tighter aisles speed travel but reduce forklift clearance and increase near-miss frequency.
- More dock activity means more trailers, more backing, and more pedestrian-vehicle interaction in the yard.
Ergonomic fixes that also help flow: adjustable pick heights, lift assists for heavy SKUs, and anti-fatigue matting at stationary stations. These reduce lost-time incidents that stall flow worse than any layout flaw.
Coordinate the Yard with the Dock Schedule
Yard space is the piece most teams forget. Congested yards delay dock scheduling, which backs up receiving, which stalls the whole flow.
Practical yard coordination steps:
- Assign trailer parking by appointment window, not first-come
- Track trailer dwell time the same way you track dock-to-stock time
- Keep a clear lane for live loads so they never wait behind parked trailers
- Schedule waste and recycling pickups outside peak receiving windows
This is where we see distribution centers overlook a simple fix: waste volume. Full dumpsters eat yard space and trigger extra hauler trips that compete with trailers for room.
Junk Crusher crushes dumpster waste on site, cutting roll-off volume by up to 70% and reducing the number of hauls you pay for. For facilities tight on yard space, that means fewer containers sitting around and fewer trucks in the queue. You can see current options on our dumpster rental page.
Common Mistakes That Stall Logistics Flow Improvements
The same errors show up in facility after facility:
- Buying software first. Fix layout and slotting before you automate anything.
- Tracking too many KPIs. Five well-defined metrics beat twenty nobody reads.
- Auditing during slow periods. You will miss the bottlenecks that actually cost you.
- Reslotting once a year. Demand moves faster than that.
- Leaving the yard out of the plan. Waste containers, trailers, and staging all compete for the same pavement.
- Changing everything at once. One zone, one change, then measure.
What most guides miss is how much of the flow problem sits outside the four walls. A clogged yard stalls receiving as surely as a slow picker stalls shipping.
Conclusion: Measure, Adjust, Repeat
Flow work never really finishes. Demand shifts, SKUs change, and last quarter's fix becomes this quarter's bottleneck.
Start with the audit. Fix the layout. Track five KPIs. Then adjust as the numbers move.
If yard congestion or waste hauling is part of what is slowing you down, Junk Crusher can help. Our mobile compacting service crushes dumpster waste on site, cuts hauling volume by up to 70%, and reduces the truck trips competing with your trailers for space. It is a greener, lower-cost alternative to paying to haul empty air.
Book a Crush with Junk Crusher and free up your yard, your dock schedule, and your operating budget.
Frequently Asked Questions
What are the 5 key performance indicators in logistics?
The five most useful KPIs for distribution centers are order cycle time (from order receipt to shipment), dock-to-stock time (from unload to putaway), pick rate per labor hour, on-time delivery percentage, and inventory accuracy. Track these weekly rather than monthly so you catch bottlenecks before they compound. Order cycle time and dock-to-stock time are the two that most directly reveal where logistics flow breaks down between receiving, putaway, picking, and shipping.
How can warehouse layout improve material flow?
Layout determines how far workers and equipment travel. Slot fast-moving SKUs near shipping docks, create one-way pick paths to avoid congestion, and separate receiving lanes from outbound staging. A layout that puts high-velocity items in the golden zone (waist to shoulder height, closest to dispatch) cuts walking time and reduces pick errors. Even a modest rearrangement of pick paths can shorten order cycle time without buying any new equipment.
How can a distribution center reduce bottlenecks?
Start by timing each stage: receiving, putaway, picking, packing, and staging. The stage with the longest queue relative to its capacity is your bottleneck. Common fixes include adding a dedicated putaway crew during peak receiving hours, staggering dock appointments to smooth inbound volume, and cross-docking high-velocity SKUs so they bypass storage entirely. Resolving one bottleneck often reveals the next, so re-audit after each change.
What technology helps improve logistics flow in a distribution center?
A warehouse management system (WMS) with real-time inventory visibility is the foundation. Look for directed putaway, dynamic pick-path generation, and dock scheduling modules. Barcode or RFID scanning at each touchpoint feeds the WMS accurate data, which makes KPIs trustworthy. Before buying, confirm the WMS integrates with your existing ERP and carrier communication tools; a system that requires manual data re-entry will slow flow rather than improve it.


