
Cost of Implementing Zero Waste Programs: 2026 Guide
Table of Contents
- What Zero Waste Programs Actually Cost to Implement
- Building a Business Waste Audit That Prices Your Real Costs
- Line-Item Budget: Where the Money Goes
- Step-by-Step Cost-Estimation Method
- Industrial Waste Reduction Strategies That Cut Hauling Costs
- Zero-Waste ROI, Payback Period, and Scenario Modeling
- Rolling Out Your Zero-Zero Implementation Plan
- Frequently Asked Questions
Last Updated: October 9, 2026
What Zero Waste Programs Actually Cost to Implement
Zero waste programs are structured plans that cut the waste a business sends to landfill by reducing, reusing, recycling, and recirculating materials.
At Junk Crusher, we work with manufacturers, warehouses, and construction crews that want lower disposal bills without adding complexity. The biggest cost driver is rarely the recycling bin.
Two cost buckets matter, and mixing them up wrecks your budget.
One-Time vs Ongoing Costs
One-time costs cover setup. Ongoing costs repeat every month.
One-time costs:
- Waste audit and waste characterization
- Bins, labels, and signage
- Equipment such as balers or compactors
Ongoing costs:
- Hauling and disposal fees
- Collection services
- Program management labor
A common mistake is budgeting only for bins and then getting surprised by labor. Track both buckets from day one.
Building a Business Waste Audit That Prices Your Real Costs
A business waste audit is a structured review of what your site throws away, in what volume, and where it goes. It converts guesswork into numbers you can price.
Here is how we would run one:
- Pick a representative week, not a slow one.
- Weigh or estimate each waste stream separately.
- Note where each stream is generated on site.
- Record current hauling frequency and container sizes.
- Identify what could be reused, sold, or diverted.
Waste Characterization: What to Measure and Why
Waste characterization is the step where you open the bags and sort them. It sounds unpleasant.
Measure these four things:
- Volume by material (cardboard, wood, metal, shingles, organics)
- Contamination rate in each recycling stream
- Participation rate by shift or department
Many teams find that one or two materials make up most of their weight. Fixing those first is cheaper than fixing everything.
The U.S. Environmental Protection Agency's guidance on managing and reducing waste outlines how to categorize solid waste streams before you set targets.
Line-Item Budget: Where the Money Goes
Build the budget as line items, not a lump sum. That way you can cut or delay specific pieces when cash is tight, and you can defend each number to a CFO.
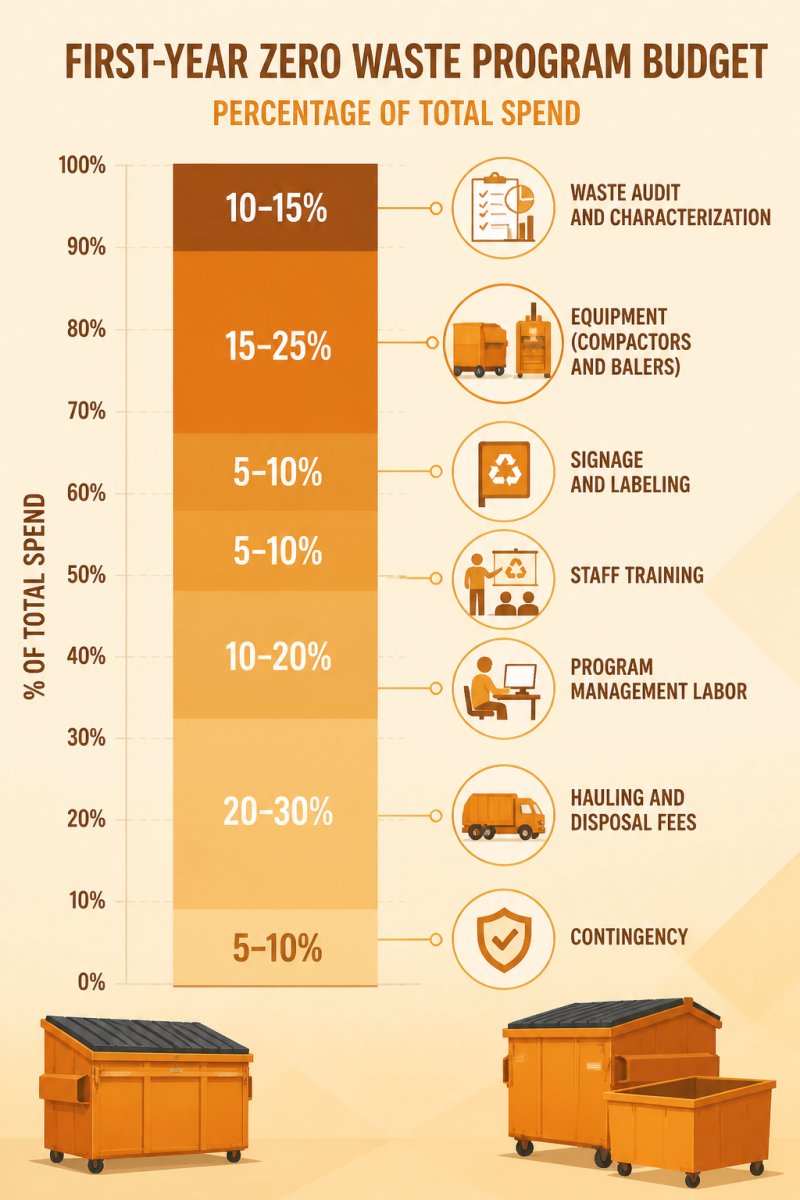
Below is the working structure we use. The right-hand column explains what actually drives the number up or down, because the driver matters more than the line itself.
| Budget Category | Cost Type | Primary Cost Driver |
|---|---|---|
| Waste audit and characterization | One-time | Whether you self-perform or bring in a third party, and how many days of sorting are required |
| Containers, bins, and internal collection carts | One-time | Number of generation points, not total square footage |
| Signage and labeling | One-time | Number of collection points times number of streams |
| Equipment (balers, compactors, carts) | One-time | Volume per week and whether you buy, lease, or rent |
| Staff training | One-time, then recurring | Headcount, shift count, and turnover rate |
| Program management labor | Ongoing | Hours per week to own the program, audit contamination, and report |
| Hauling and disposal fees | Ongoing | Container size, pickup frequency, and whether you are billed by volume or by weight |
| Contamination re-sorting | Ongoing, variable | Participation rate and how well signage matches the actual stream |
| Reporting and data tracking | Ongoing | Whether you track manually or use a vendor portal |
| Contingency | Both | Historical contamination spikes and equipment downtime |
Sizing the Two Lines That Dominate
In most programs we see, two lines account for the majority of first-year spend: hauling and disposal fees, and program management labor. Everything else is comparatively small.
Hauling and disposal fees. These scale with container size, pickup frequency, and billing method. If your hauler bills by volume, you are paying for empty space inside the container every time it is pulled.
Program management labor. This is the line teams forget. Someone has to own the program, check contamination, retrain staff after turnover, and pull monthly numbers.
One-Time vs Ongoing, Kept Separate
Keep the two buckets on separate tabs or separate columns. One-time costs are a capital-style decision you make once. Ongoing costs are an operating commitment you carry every month. Mixing them hides the true run rate and makes payback math impossible.
Where Compaction Fits the Budget
On-site compaction is a capital or rental line, but it acts on the hauling line. Crushing waste inside the container means each pull carries more material, which reduces pickup frequency without reducing the waste you generate.
We offer 20 and 25 yard dumpsters for exactly this reason: they match the volume profile of most mid-size industrial and commercial sites, and they pair well with compaction when the stream is bulky rather than dense. If you would rather not buy a container outright, Dumpster Rental covers the same sizes on a short-term or ongoing basis.
Ask your hauler whether they charge by volume or by weight. If it is volume, compaction is almost always the fastest payback item on your list.
Step-by-Step Cost-Estimation Method
You can estimate your numbers in about an hour with a calculator and your last few hauler invoices.
- Total your current annual hauling and disposal spend. Pull twelve months of invoices.
- Estimate your diversion potential. Use your audit to set a realistic diversion rate.
- Price the one-time setup. Add equipment, signage, training, and audit labor.
- Price ongoing labor. Estimate hours per week for program management.
- Apply a contingency. Add a buffer on top of setup and first-year operating costs.
- Subtract avoided costs. Lower hauling frequency and fewer disposal fees offset the spend.
- Divide to find payback. Setup cost divided by monthly savings equals your payback period.
Steps one and six carry the most weight. If you cannot measure current hauling spend, you cannot prove savings later.
Industrial Waste Reduction Strategies That Cut Hauling Costs
Industrial waste reduction strategies work best when they attack volume before they attack material. Less volume means fewer hauls, and fewer hauls means lower operating costs.
The strategies that move the needle fastest:
- Source reduction: change purchasing so less scrap is created
- Reuse and material recirculation: return pallets, totes, and crates to the supply chain
- On-site compaction: crush waste in the container so each haul carries more
Pay-as-you-throw pricing makes this concrete. When you pay per container or per ton, every cubic foot of empty space costs money.
Reducing truck trips also lowers greenhouse-gas emissions, which helps if you report environmental impact. The U.S. EPA's waste reduction and recycling resources explains how diversion ties to emissions reporting.
Ask your hauler whether they charge by volume or by weight. If it is volume, compaction is almost always the fastest payback item on your list.
Zero-Waste ROI, Payback Period, and Scenario Modeling
Zero-waste ROI is the savings from avoided disposal and hauling divided by what you spent to get there. Payback period is how long it takes those savings to cover your setup cost. Both are simple arithmetic once you have three inputs.
The Three Inputs You Need
- Current annual hauling and disposal spend. Pull twelve months of hauler invoices and total them.
- Expected reduction in hauls per year. This comes from your audit and your diversion target, not from optimism.
- One-time setup cost. Audit, containers, signage, equipment, and training.
The Formulas
- Annual savings = (current annual hauling and disposal spend) × (percent reduction in hauls)
- Payback period in months = (one-time setup cost) ÷ (annual savings ÷ 12)
- First-year ROI = (annual savings − one-time setup cost − first-year operating cost) ÷ (one-time setup cost + first-year operating cost)
Run the conservative case first. If it still pays back inside a window your finance team accepts, the program is safe to launch. If it only pays back in the aggressive case, you are betting on execution you have not proven yet.
Scenario Modeling
| Scenario | Diversion Rate | Haul Reduction | Setup Spend | Payback Outlook |
|---|---|---|---|---|
| Conservative | Low | Small | Minimal | Longest payback; safest to defend |
| Realistic | Moderate | Moderate | Moderate | Balanced; typical planning case |
| Aggressive | High | Large | Higher | Fastest payback; requires strong execution |
The trap is that the aggressive scenario usually assumes both a high diversion rate and a large haul reduction at the same time. Those two do not always move together. A high diversion rate with poor compaction can still leave you pulling the same number of containers.
What Actually Drives the Return
Most of the return comes from avoided hauling, not from selling recovered materials. Scrap rebates help, but they are rarely the main driver, and they fluctuate with commodity markets you do not control.
A common pattern is that the first two or three material streams, usually cardboard, metal, and one bulky stream, deliver most of the savings. Chasing the long tail of small streams adds complexity without moving the payback number much.
Sensitivity: What Breaks the Model
Test three variables before you commit:
- Contamination rate. If contamination forces re-sorting or rejected loads, savings shrink fast.
- Participation rate. Low participation at the source means the diversion rate never materializes.
- Hauler contract terms. Minimum pulls, fuel surcharges, and container rental fees can mute the savings from fewer hauls.
If the model survives a bad contamination month and a slow participation ramp, it is a real model.
Facilities that generate heavy, bulky waste such as shingles, wood, or cardboard, where volume reduction delivers the clearest return.
Rolling Out Your Zero-Zero Implementation Plan
A zero-waste implementation plan is the written sequence of who does what, by when, and how you will measure it. Without one, programs stall after the first month.
Build it in phases:
- Phase 1: finish the audit and set a baseline diversion rate
- Phase 2: install equipment, signage, and collection points
- Phase 3: train staff and start tracking contamination
- Phase 4: tune hauling schedules against real fill data
- Phase 5: review results quarterly and adjust targets
Assign one owner. Programs with a named manager hold their numbers far better than programs run by committee.
Track participation rate and contamination rate monthly. Both predict whether your diversion rate will hold.
Frequently Asked Questions
What are the main costs of a zero-waste program?
The biggest categories are waste audits and characterization, equipment such as compactors, balers, and sorting bins, signage and labeling, staff training, program management labor, and ongoing hauling and disposal fees. One-time costs cluster in the first year, while hauling, labor, and program management recur every year. The balance shifts by facility: a distribution center with high cardboard volume may spend more on a baler up front but cut collection frequency, while a plant with mixed debris may need a mobile compaction service instead of fixed equipment.
How do you calculate the return on investment for waste reduction?
Start with your current annual spend on hauling, disposal fees, and transfer station charges. Estimate how much volume diversion, reuse, and compaction will remove from that total, then subtract annual operating costs like labor, training, and equipment maintenance. Divide your net annual savings into your total implementation cost to get the payback period in years. Run three scenarios, conservative, expected, and optimistic, because participation rate and contamination rate move the result more than any other variable.
Can a zero-waste program save a business money?
Savings come from three places: fewer hauls, lower disposal fees, and avoided procurement of materials you can reuse or recirculate. The largest single lever for many facilities is volume reduction before hauling, since haulers bill by container and trip, not by weight alone. Cutting the number of pickups per month reduces both hauling costs and the labor tied to moving and staging waste. Pair that with a waste audit so you know which streams actually generate the savings before you commit budget.
How can manufacturers reduce waste disposal costs?
Audit first, then target the heaviest and most frequent streams. Source reduction at the line, material recovery for scrap and packaging, and on-site volume reduction before hauling all lower disposal fees. For industrial sites, compaction is often the fastest payback because it reduces the number of roll-off pulls without changing your production process. Track diversion rate, contamination rate, and participation rate monthly so you can prove the savings and adjust the program instead of guessing.
Waste costs creep up quietly, and most teams only notice after a year of overpaying for hauling empty space. Junk Crusher helps fix that at the source with mobile on-site dumpster compaction that cuts roll-off volume by up to 70%, reduces haul frequency, and lowers the number of truck trips on your site. If you also need containers, we offer 20 and 25 yard dumpsters alongside the service. Book a Crush with Junk Crusher and start paying for waste, not air.


